The Art of the Knife Catch: Reading the Market Like a Samurai
4/11/20254 min read
Don't catch a falling knife, they say.
Yeah, for sure—but that's exactly where the juiciest trades are.
Sure, sometimes you'll get stopped out. But do you really think you'll be rewarded for following the same tired motto as everyone else?
One thing is certain: if you're only looking at a price chart, you're doomed trying to play this game.
But when you’ve got night vision goggles on, you can start playing in this market.
Trends always revert at some point. The question is: when?
Trying to time a top or bottom is high risk. These phases are volatile, and if you're overleveraged and playing with tight stops, you won’t last long.
So, if you want to play the hero here, you must know what you're doing. And above all, use low leverage.
To survive long-term in this game, follow the 1% rule—it’s simple but solid:
Never risk more than 1% of your capital on a single trade.
Even very skilled traders go through long losing streaks. You need to keep enough room to adapt and stay alive until you're back in sync with the market.
That said, catching falling knives and trading V-bottom reversals is a game you can play—if you’re prepared with the right leverage and proper stop placement.
Let’s be clear: if you use the same data as everyone else—price and volume—it’ll be hard to time the market precisely enough to be consistently profitable.
That’s why we built COBALT.
It goes beyond price and volume.
It shows you how the order book is positioned and how aggressive traders are behaving.
Introducing: Buy/Sell Speed
This is the rate at which an instrument is being bought or sold by market takers (the aggressive, impatient, or forced traders).
It's measured in BTC/seconds for the case we will be looking here (BTC/USDT on Binance spot, where a big part of the action takes place).
Buy Speed MA: the moving average of buy speed.
Buy/Sell Speed MA: the moving average of the difference between buy and sell speed.
Positive values = aggressive buyers dominate. Negative values = aggressive sellers dominate.
Here’s what’s striking:
Big spikes in the Buy/Sell Speed MA (relative to recent activity) often mark reversal points.
Why?
When price starts to move, smart traders enter early and ride the wave.
Then, as key levels break, stops from cautious traders get triggered, fueling the move even more.
Finally, you get two classic groups of unprofitable traders:
Those who FOMO in just before the reversal,
And those who get liquidated. Game over. Their margin is gone, and the exchange forcefully closes their positions to avoid loss.
That’s when you get a peak of aggressive activity—and it’s unsustainable.
At some point, there’s simply no one left to keep pushing the price.
Meanwhile, the early traders are taking profits and closing positions.
This combination—no more dry powder on one side, plus profit-taking on the other—forces a sharp price reversal.
Case Study: April 6/7th, 2025
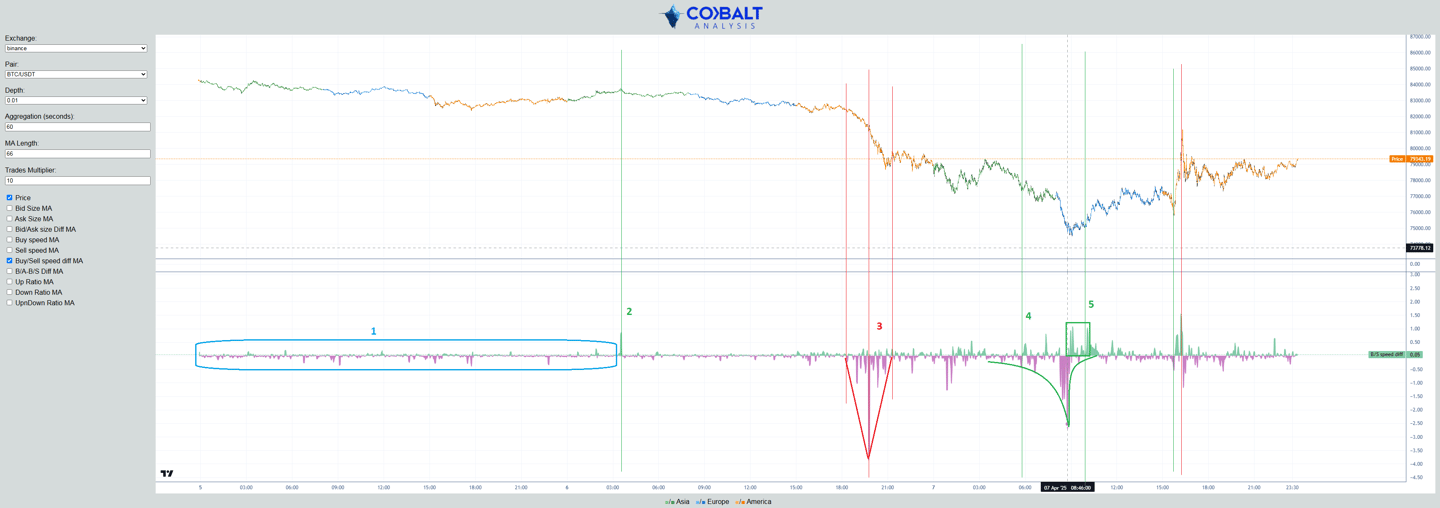
Let’s break it down with the chart above.
We set the MA length to 66 for high sensitivity on fast moves.
In zone #1, the Buy/Sell Speed MA stays relatively calm. It’s a boring range, with a slight bearish skew—price drifts lower.
The first notable spike comes in zone #2, around 3 AM. A sharp burst of buying pressure. Guess what? That was the top. Buyers threw everything they had, and once they were out of ammo, the market turned lower.
The question now is: how will we time the moment when we reach the bottom of this hellish descent?
This was a tense market—Trump’s new tariffs had just been announced, and uncertainty was everywhere.
Trying to go long here is risky, but potentially rewarding.
You need to stay underleveraged and ready to adapt quickly.
When the price starts to drop significantly, during US hours as usual, oversell spikes start to appear, with a very big one around 20:00 (zone #3) and then smaller ones, with the price somehow stabilizing.
You could think it is a good time to play long.
But we need more context—we pull data from the order book with a longer MA to get a broader picture on this second chart below.
Here when we look at makers positioning, we clearly see that they still are shorting this price action.
Indeed, the Ask size is way higher than the Bid size here, so the price has little chance to go up.
So even if the selling slows, there’s no support to push price back up.
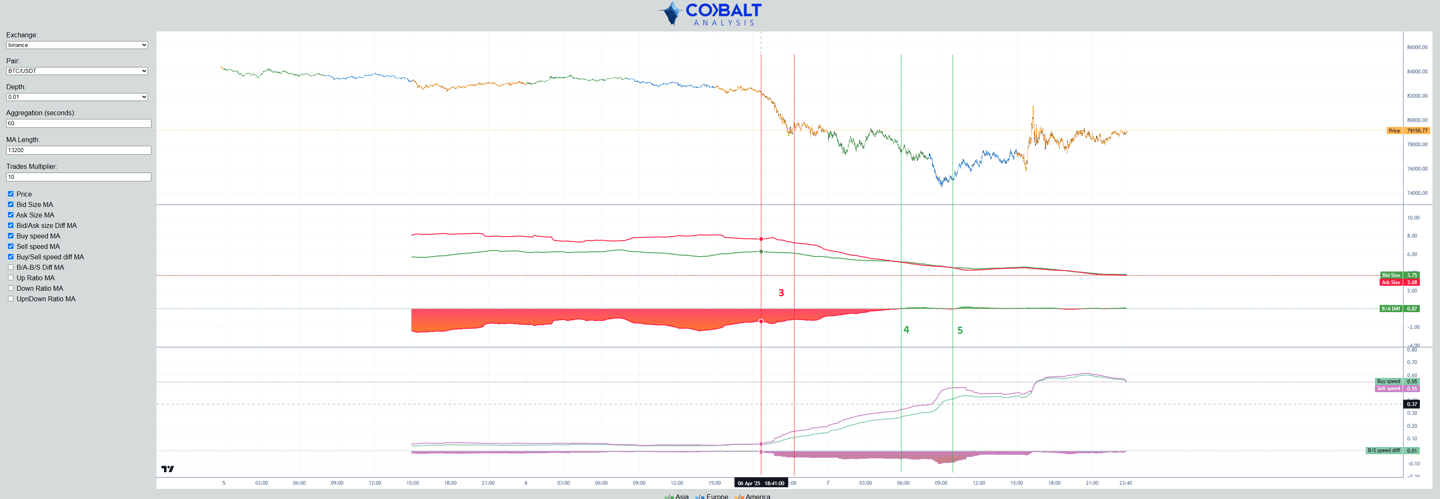
Fast forward to zone #4 on the second chart:
Finally, bid and ask sizes are balanced—and both are lower.
That means market makers have widened their spreads due to high volatility.
Now, the setup is clear:
If sellers capitulate and aggressive buyers step in, the trend can reverse.
And that’s exactly what happens:
Sell speed spikes increase.
Then they fade out: sellers are exhausted.
Meanwhile, buyers are already stepping in.
At zone #5, the bottom is in. The setup is clean for a long entry: price has dropped significantly and sharply, aggressive sellers are exhausted, and both aggressive and passive buyers are showing genuine interest.
The bounce that follows is real profit for you to take.
Then, new spikes come in toward the end. The market reverses twice in a short period.
Each time, it coincides with a Buy/Sell Speed MA spike.
Though these were fast moves—not easy to catch.
So yeah—you can catch falling knives.
It's not magic, it’s logic.
This type of setup isn’t easy to spot, but with experience and the right tools, you can execute moves that put you ahead of the 80% who consistently lose money blindly trading like everyone else.
We built COBALT to empower fast-thinking traders with the right data and visualizations to master these moments.
We're not building fancy dashboards.
We're building useful tools—designed for real-time decisions in fast-moving markets.